
Upcoming Events

-
2024 Rising Leaders Topgolf Tournament
May 23, 2024
12:00 pm - 4:00 pm

-
Building Tomorrow Together
June 21, 2024
7:30 am - 11:30 am
-
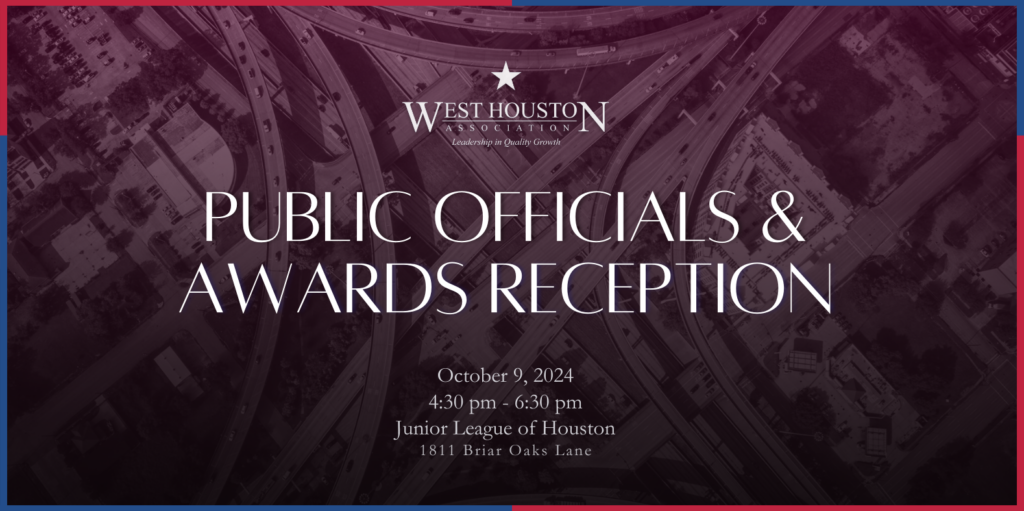
Public Officials & Awards Reception
October 9, 2024
4:30 pm - 6:30 pm
WHA Developments – Our Latest Articles
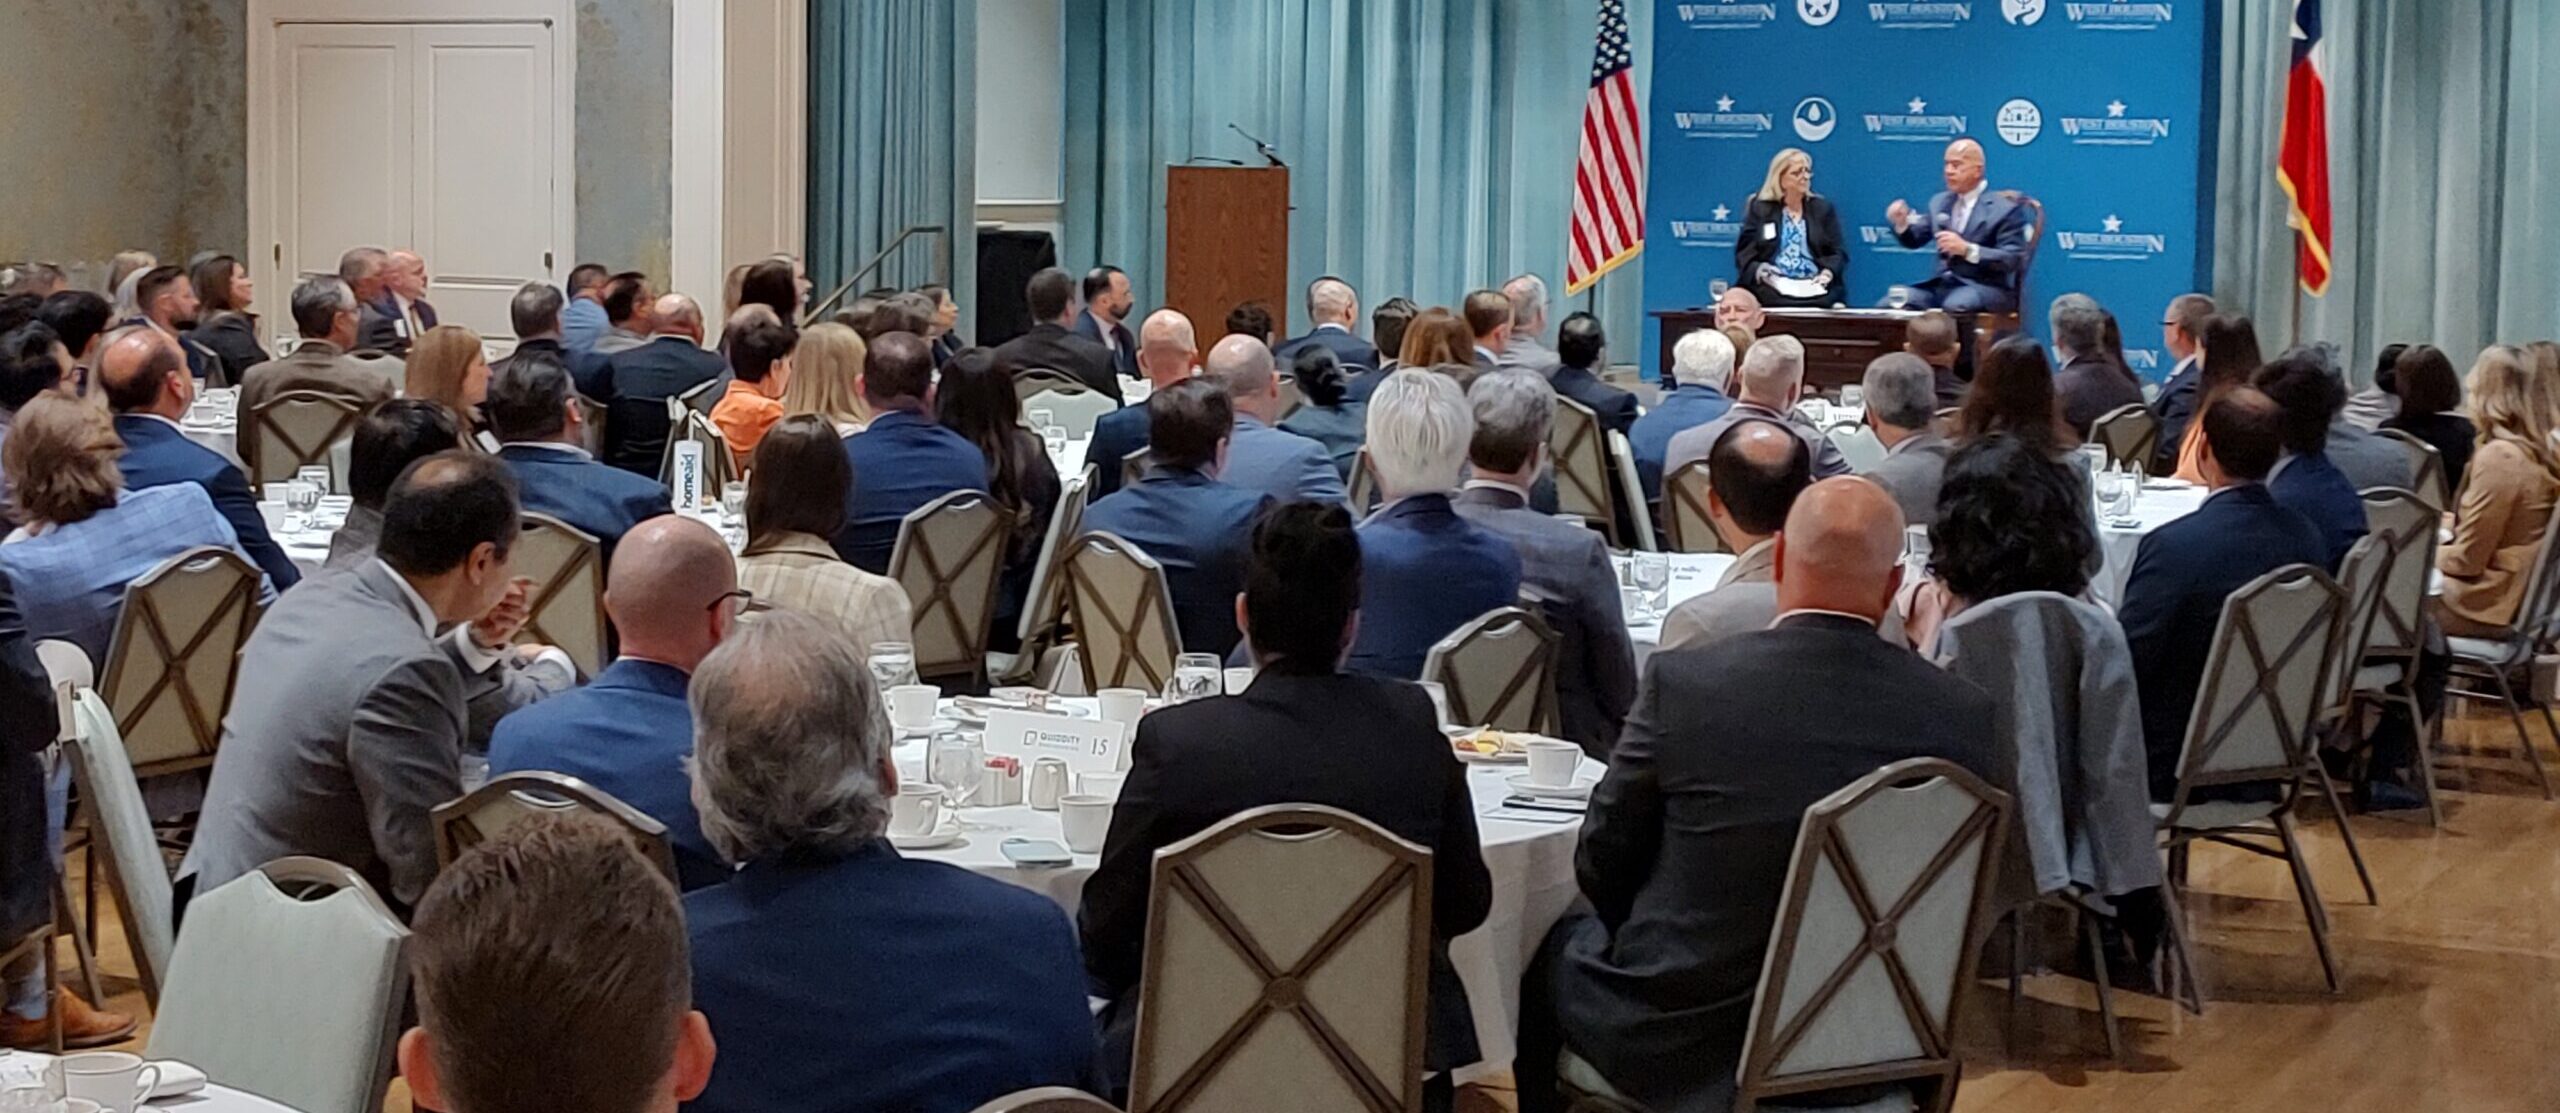
The First 100 Days & the Years Ahead: A Chat with Mayor Whitmire
On Thursday, March 28th, 2024, the West Houston Association held a fireside chat with Houston Mayor John Whitmire, titled the First 100 Days & the Years Ahead. The talk was moderated by Lisa Clark (W Land Development) and covered the […]

Harnessing Rainwater: A Blueprint for Sustainable Infrastructure
In a world where water scarcity looms large on the horizon and environmental sustainability is paramount, developers, owners, MUDs and local governments are seeking different sources of water supply. Locally, as the cost of water increases and concerns about subsidence […]
Cities Must Earn the Ability to Retain Their Extra-Territorial Jurisdiction
Texas municipal annexation reform has steadily progressed since Houston’s unpopular annexation of Kingwood in 1996. As suburban populations grew, so did frustrations with the far afield city halls that governed them. In 2017, the Texas Legislature passed SB 6. With […]
Leadership in Quality Growth Since 1979
The West Houston Association is a non-profit organization working to create a better living and working environment for the 2 million people who live, work, and play in Greater West Houston. We are industry leaders who collaborate, educate, and advocate to achieve the best quality of life, experience, and opportunity in Greater West Houston by promoting high-quality development, sustainable infrastructure, and long-term planning within Greater West Houston’s 1,000 square miles.
Our Members
We are property owners, major employers, and related firms and community interests working together to advocate for improved mobility, better infrastructure, and a sustainable quality of life for the region. We believe quality, sustainable infrastructure that is well-planned and well-timed benefits everyone in our region.
Get Involved
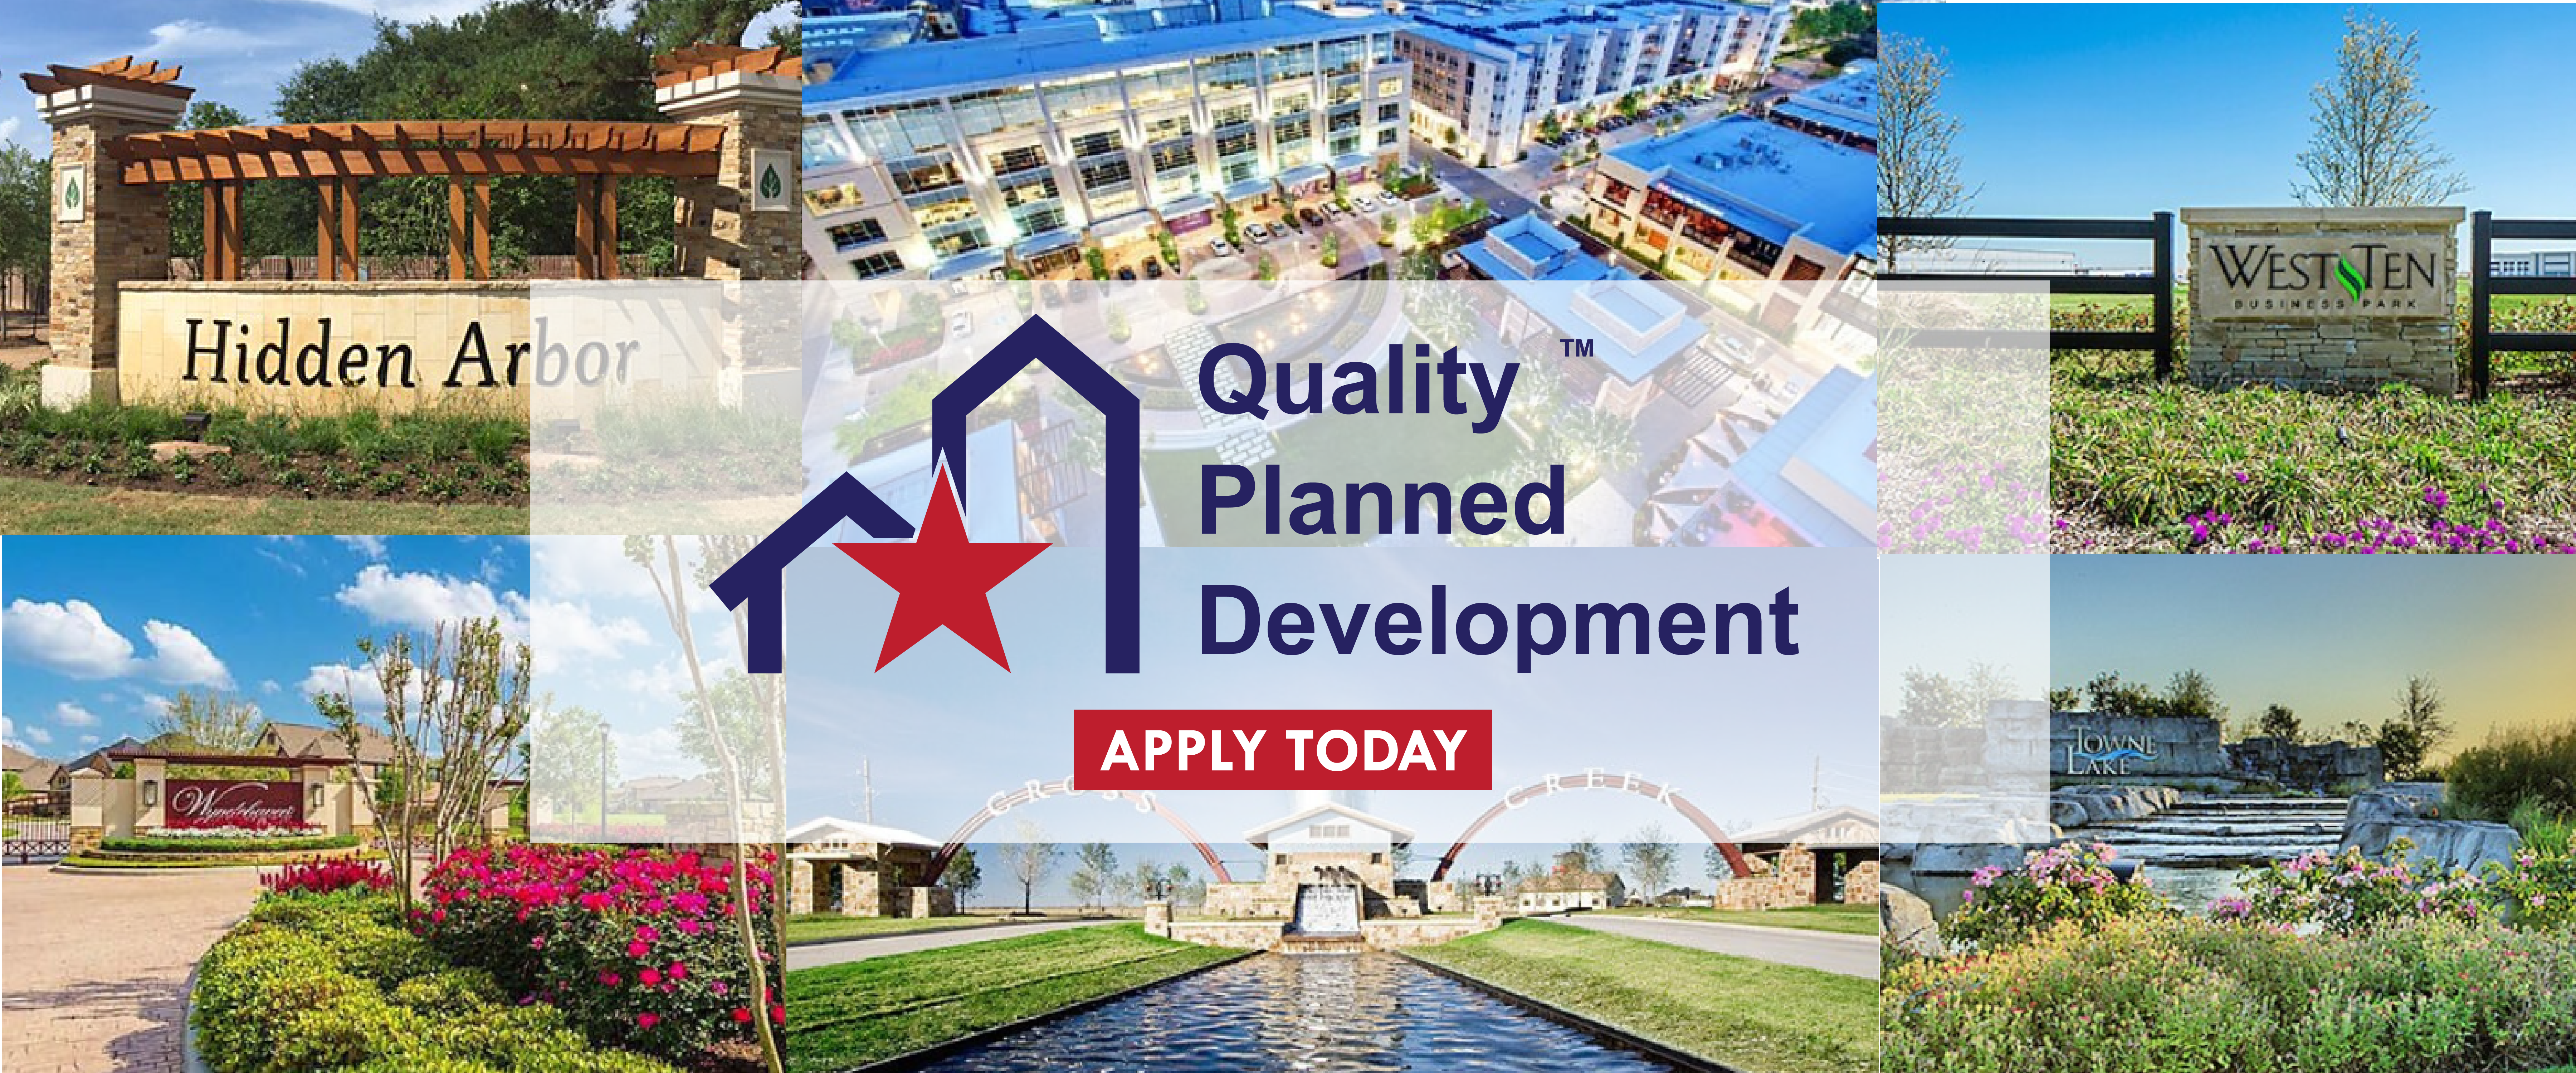
2024 Quality Growth Partners